When You Use Electricity Matters A Lot!
User: kazuokev@hotmail.com
Vendor: None
Action: 3393 - Green Your Electricity
- All TestimonialsSummer is here, and we've already had two heat waves. Extreme weather situations cause us to use our resources very differently--hopefully the graphs and articles in this testimonial help you better understand how seasonal and weather variations have a huge effect on how we use energy and, as a result, have a huge effect on the cost of the electricity we use, the amount of pollution which results from that usage, and ultimately how you the humble consumer can reduce both.
In the shoulder seasons (spring and fall), electricity demand is relatively low because modest and comfortable temperatures lead to less use of heating and cooling. This article from the Connecticut Mirror explains how the seasonably cool and sunny conditions on Easter Sunday lead to an all-time low demand level on the New England electric grid. New England power demand fell to an all-time low on Easter The article undersells (IMHO) the real news here: behind-the-meter solar production (i.e. rooftop solar) peaked at an estimated 6,600 megawatts; at the same time, grid demand (i.e. production by the numerous big power plants around the region) bottomed at 5,318 megawatts—in other words, rooftop solar’s peak caused demand on the electric grid to be about 55% met by rooftop solar! For anybody who wonders whether you can make a difference, this is one shining example (pun definitely intended!) of the collective decisions of tens of thousands of homeowners to put solar on their roofs resulting in this record low demand.
I created some charts using the Iso New England website. This chart shows how low demand dropped on April 20. The darker orange line at the bottom is what the power provided by the large power plants, hitting bottom around 2pm. The lighter orage line adds in the estimated production from rooftop solar, which you can see picks up around 6am and stops around 7pm.
On the other end of the spectrum, grid demand hit a year-to-date high (by a long shot) on Tuesday June 24 amidst 100 degree temperatures across the region. This article from WBUR’s excellent climate reporter, Miriam Wasser, includes some interesting graphics and data showing how rooftop solar reduces the amount of electricity needed from fossil-fuel sources and therefore reducing the carbon and particulate pollution associated with burning the additional oil/coal/gas that is typically called upon at “peak” demand moments. How rooftop solar is helping New England stay cool during the heat wave | WBUR News.
Below is the same chart as above except for June 24. A couple of observations and comparisons to the April 20 chart. First, the shape of the power curve is completely different, with the daily bottom occuring around 4 am with demand ramping up all day to the peak at about 6:30 pm. Also note the difference in the level--the 4am grid demand was about 15,400 megawatts on June 24, versus the 11,900 peak at 7 pm on April 20. Also note the interesting shift in the daily peak, where grid-provided electricity peaked at 6:30, but overall usage peaked around 4 due to about 4 megawatts of rooftop solar filling in that gap.
As I mentioned at the opening, the cost and pollution difference between April 20 and June 24 were also huge.
Here are the charts of estimated carbon emissions (particulate pollution is completely separate) and locational marginal pricing (LMP is not literally the wholesale price of electricity, but it's close enough for our purposes) from April 20. You will see that carbon emissions hit a bottom of about 20 metric tons per megawatt, holding that bottom from about 10am to 3pm at which time rooftop solar was hitting peak production. You will also see that LMP briefly hit a peak of $62 at 8pm but fluctuated between $15 per megawatt and negative $50 per megawatt between 9am and 3pm when rooftop solar was meeting up to 55% of our collective electric demand. Yes, negative $50--this was the grid operator's price signal that any power plant with the ability to shut off would be paid handsomely to do so.

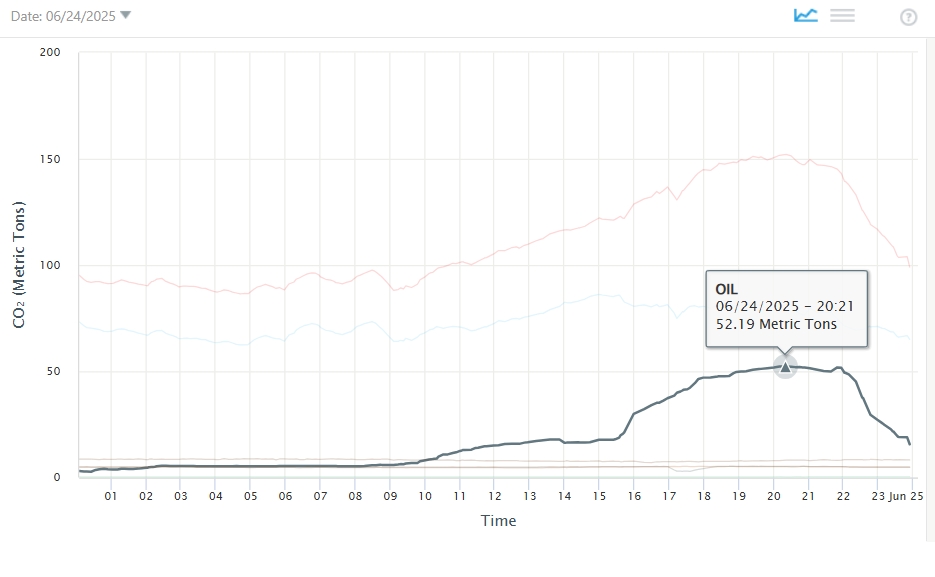
In contrast, here are the carbon emission and LMP charts for June 24 when peak emissions hit about 152 tons per megawatt, 7 times greater than the April 20 bottom and 3.5 times the April 20 peak. A lot of that additional pollution was from oil burning peaker plant(s) that came online and really ramped up from about 3pm to 9pm which you can see in the gray line in the emissions chart which peaked at 50 tons per megawatt in that timeframe. Oil-burning plants are typically too expensive a resource to operate during normal conditions, and so they only fire up infrequently--which is exactly why avoiding consumption under those abnormal conditions is so valuable in avoided cost and pollution. At the peak, Oil was producing about 32% of total carbon emissions while only generating about 12% of the electricity--not a good ratio, and which does not account for the non-carbon pollution also caused by burning oil.
Remember the negative $50 price signal from April 20? What about a $1,560 per megawatt price signal to incentivize an otherwise too-expensive oil plant to fire up at 5:40 on June 24? That plateau of about $1,000 lasted until about 8:30pm, when it fell to about $250 at 9:30pm and finally back to the day's $60 baseline around 10pm. Comparing the two days, the baseline LMP on June 24 was the (brief) peak price on April 20, and then there's the $1600 LMP difference between peak on June 24 and bottom on April 20. So that begs the question: how does that affect the price we pay for electricity? In the short run, it doesn't because almost everybody has a fixed supply price contract; however, the wholesale cost of electricity eventually gets passed through to all of us eventually. Remember how electricity supply prices jumped in 2022-2023, in delayed response to a certain world event in February 2022 which caused chaos in gas markets? (chaos in other ways too, but that's beyond the scope of this testimonial).
This website being focused on actions, here's our suggestion: shave the peak! Our friends at Green Energy Consumer Alliance offer an email alert for days when reducing peak demand is particularly impactful. Hot Days Ahead! Time To Shave The Peak. Think of the electric grid like a highway—just as you would want to avoid the aggravation of driving to Boston at 8am on a typical weekday if at all possible, so too would you want to avoid consuming electricity at peak times everyday but especially amidst heat waves or major cold snaps. While true that the aggravation of sitting in traffic is more tangible than the aggravation of increased air pollution (unless you or someone you know has respiratory conditions), the added power costs and additional pollution is expensive, we just don’t necessarily directly see it.
Speaking of solutions, with the end of 30% federal tax credit on solar pv installations basically guaranteed, Massachusetts just passed an emergency regulation implementing a new solar incentive effective immediately. See the details here: Massachusetts solar incentives bolster industry facing… | Canary Media. Oddly, certain key details like the compensation rate for new installations are still to-be-determined. This bears watching, but is likely to be an improvement over the expiring SMART incentive which has been zero or close to it due to the increased cost of electricity in the last few years.
This was longer than I intended, but as the saying goes, a picture is worth a thousand words. My suggestion is simple: think ahead so you can time your electricity consumption to avoid peak times whenver possible and to coincide with ideal times, like when temperatures are seasonally mild and the sun is shining. With practice, it becomes a habit. If you can defer or avoid running your dishwasher, charging your car, cooking a meal (have a salad on a hot day!). If you have a programmable thermostat, maybe you can pre-cool your house so that your air conditioner is not starting to cool at 5pm when your house has already run up to 80 degrees. All of these things matter, because after all, isn't grid demand merely the sum of all of our decisions to use electricity?


